
The main takeaway is simple: when hospitals track IV line data and share it with staff, patient harm drops.
I found the article points to the same pattern across peripheral IVs, central lines, and infusion pumps: measure problems, show the data, and act on it. In practice, that meant lower phlebitis rates, fewer CLABSIs, and more medication programming mistakes stopped before they reached patients.
Here’s the article in plain English:
- Peripheral IV problems are common. U.S. estimates in the article put infiltration at 24%, occlusion at 18.8%, and phlebitis at 15.5%.
- These events add cost and time. Peripheral IV complications were linked to about 2 extra hospital days and more than $3,000 in added cost per case.
- CLABSI is less common but much harder on patients and hospitals. The article cites about 30,100 cases per year in U.S. acute care settings, with a median cost of $44,810 and a median stay of 16.9 days.
- Checklist-and-feedback programs helped lower harm. One program cut phlebitis from about 7% to 1%–2%.
- Dashboard-based central line programs cut infections. One example dropped CLABSI from 2.6 to 0.7 per 1,000 line-days.
- Smart pump logs stopped medication errors early. Pooled data showed 1.6 averted programming errors per 1,000 patient days.
- Bedside line setup also mattered. Stabilization and line-organization steps were tied to fewer restarts, less dislodgement, and fewer tubing incidents.
What matters most? Not just collecting data. The article shows that teams got better results when they reviewed the numbers often, fed them back to units, and used them to change daily practice.
If I had to boil the whole piece down to one line, it would be this: better IV line visibility helped staff act earlier, and earlier action meant fewer problems.
IV Catheters & IV Complications: Cardiovascular System - Medical Surgical | @LevelUpRN
sbb-itb-f779e18
The Burden of IV Line Complications in U.S. Care Settings
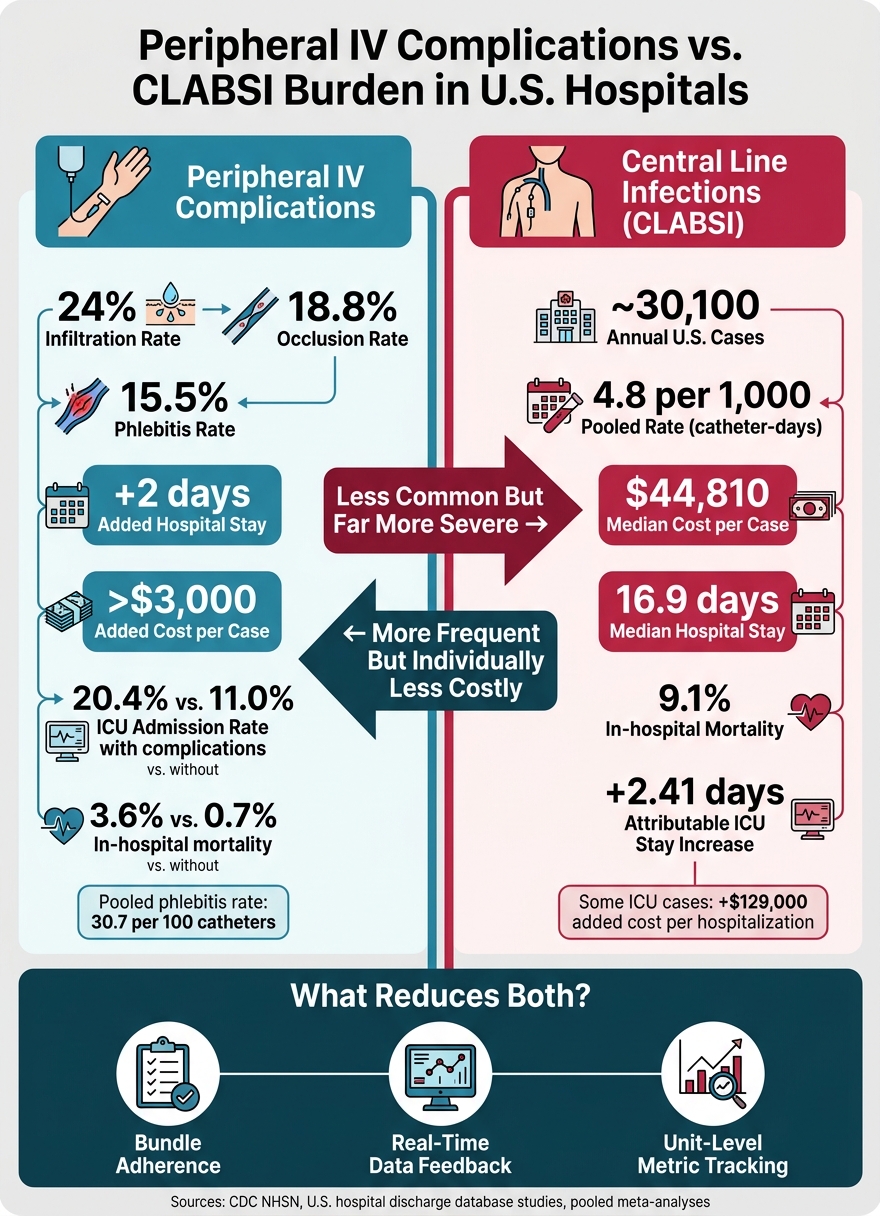
IV Line Complications: Clinical & Financial Burden at a Glance
IV line complications are common and expensive across U.S. care settings.
Peripheral IV Complications and Reported Incidence Ranges
The most common peripheral IV problems include phlebitis, infiltration, extravasation, occlusion, leakage, pain, and dislodgement. The exact rate changes based on the care setting and how closely teams track events. One meta-analysis found phlebitis at 30.7 per 100 catheters, while another systematic review reported pooled rates of 19.3% for phlebitis, 13.7% for infiltration/extravasation, and 6.4% for dislodgement across studies. Large U.S. estimates suggest infiltration happens in about 24% of peripheral IVs on average, occlusion in 18.8%, and IV-associated phlebitis in 15.5% - which adds up to tens of millions of events each year.
Rates also shift by unit. One prospective study found phlebitis incidence of 7.8 per 100 catheter-days in the ICU, compared with 3.9 per 100 catheter-days in the ED and 1.1 per 100 catheter-days in other inpatient areas. In plain terms, the sicker the patient, the longer the line stays in place, and the more closely staff watch for problems, the higher the reported rate tends to be.
These complications don't just cause local irritation at the IV site. They also add hospital days, cost, and ICU use. A U.S. hospital discharge database study found that patients with peripheral IV complications had a mean hospital stay of 5.9 days versus 3.9 days for those without, and mean hospitalization costs of $10,895 versus $7,009. In adjusted analyses, peripheral IV complications were linked to more than $3,000 in added hospital costs and about 2 extra hospital days. ICU admission was 20.4% with complications versus 11.0% without, and in-hospital mortality was 3.6% versus 0.7%.
Central Line Infection Burden and Hospital Impact
Central line-associated bloodstream infections are less common than peripheral IV problems, but each case tends to hit much harder. The CDC estimates about 30,100 CLABSIs occur each year in U.S. acute care settings. A large review across 48 studies reported a pooled CLABSI rate of 4.8 per 1,000 catheter-days, with individual study rates ranging from 0 to 23.5 per 1,000 catheter-days.
The downstream burden is heavy. CLABSI hospitalizations cost a median of $44,810 and had a median length of stay of 16.9 days, with an overall in-hospital mortality rate of 9.1%. Other analyses estimated the attributable cost of a catheter-associated bloodstream infection at $11,971, along with a 7.54-day increase in hospital length of stay and a 2.41-day increase in ICU stay. In some ICU-focused studies, bloodstream infection after central venous catheter placement was linked to a 7-day increase in hospital stay and an added $129,000 in costs for the same hospitalization.
| Complication Type | Key Metric | Reported Burden |
|---|---|---|
| Peripheral IV complications | Per 100 catheters / % of devices | U.S. estimates suggest infiltration 24%, occlusion 18.8%, and phlebitis 15.5%; pooled infiltration/extravasation 13.7% and dislodgement 6.4% |
| Peripheral IV complications (downstream) | LOS and cost difference | +2 days LOS; >$3,000 added cost per case |
| CLABSI | Per 1,000 central line days | Pooled 4.8 per 1,000 catheter-days; about 30,100 annual U.S. cases |
| CLABSI (downstream) | Median cost and LOS | Median $44,810 cost; 16.9-day median stay; 9.1% mortality |
These numbers help explain why hospitals rely on dashboards, audits, and device logs to track line problems and cut preventable harm.
How Quality-Improvement Programs Used Data to Cut IV Line Harm
IV complications are common, and they can get expensive fast. That’s why QI programs lean on checklists, dashboards, and feedback to cut harm instead of relying on one-off reminders or a single staff education session.
Peripheral IV Bundles With Checklist Tracking and Feedback
Peripheral IV QI programs usually pair a standard care bundle with a checklist that tracks each step of insertion and maintenance: hand hygiene, skin antisepsis, site selection, securement, and scheduled site assessment. The checklist documents whether each step happened, and teams then look at compliance data alongside complication trends to spot missed practices and fix them.
This approach has shown clear results. One bundle program cut phlebitis from about 7% to 1%–2% and reduced peripheral-IV–linked Staphylococcus aureus bacteremia from 0.61 to 0.26 episodes per 10,000 patient-days. Larger evidence reviews point in the same direction: bundle use was tied to a relative risk of 0.15 for infiltration and 0.33 for phlebitis, which means both problems fell sharply compared with standard care.
The key point is that the checklist by itself didn’t do the heavy lifting. The feedback loop did. Teams improved when leaders followed up, reviewed the data, and reinforced the process again and again. A single training session wasn’t enough.
The same basic data loop also applies to central lines, where fast reporting matters even more because the complications are less common but much more serious.
CLABSI Reduction Through Dashboards and Real-Time Reporting
For central lines, EMR-linked dashboards make bundle compliance and infection trends visible almost in real time. That matters because central line infections may happen less often, but when they do, the stakes are much higher.
One EMR-enhanced checklist and dashboard program dropped CLABSI rates from 2.6 per 1,000 line-days, with 19 CLABSIs across 7,322 line-days, to 0.7 per 1,000 line-days, with 7 CLABSIs across 6,155 line-days. Another PDSA-based program, which reinforced hand hygiene and tightened the CLABSI bundle, cut rates by 89%, from 31.7 to 3.5 per 1,000 line-days.
A systematic review covering 41 before–after studies found the same pattern: QI programs kept reducing CLABSI rates, and the effect was stronger when bundles and checklists were built into the effort.
Analytics, Device Data, and Line Management Interventions With Measured Outcomes
Beyond infection dashboards, device logs and bedside setup can reveal infusion mistakes and mechanical risks that are easy to miss.
Smart Pump Event Logs and Analytics for Infusion Safety
Smart pump logs track every start, stop, alarm, rate change, and override. If a programmed dose or rate goes past drug-library limits, the pump records an out-of-limit event and either stops the infusion or triggers an alert or stop.
Across pooled CQI data from multiple U.S. hospitals, smart pumps intercepted a combined rate of 1.6 averted programming errors per 1,000 patient days, split evenly between serious-to-life-threatening and moderate-harm events. That’s not a small number. It means the pumps were catching mistakes before they reached the patient.
In one large health system reviewing about 255,000 infusion starts per month, bedside alerts led nurses to reprogram or cancel continuous infusions around 400 times per month. Each of those cases represented a potential infusion-related adverse drug event (ADE) that did not happen. The same system also used CQI data to update its drug library, which cut alert fatigue by about 10% per update cycle without loosening safety limits.
The logs also picked up rare but severe errors. In a 12-month review, near-miss events included doses more than 100 times the intended amount, showing how drug-library limits and log review can help stop catastrophic decimal-point mistakes. In a pediatric ICU, a smart pump rollout found that over 17 months, the pumps intercepted 92 programming errors, and 49% had potential moderate, serious, or catastrophic severity.
The strongest programs relied on a multidisciplinary CQI team that included pharmacy, nursing, biomedical engineering, and IT. The team reviewed logs each month and updated drug libraries and workflows. Units with high override rates got focused retraining, and pumps with repeated error codes were removed for maintenance review.
Pump analytics help catch programming mistakes. Bedside line setup deals with the physical side of risk.
Stabilization, Line Organization, and Staff Practice Changes Tied to Outcomes
Catheter stabilization devices reduce catheter movement and dislodgement. That leads to longer dwell times, fewer unplanned restarts, and lower rates of phlebitis and infiltration. Fewer restarts also mean fewer needle sticks, less nursing time spent replacing lines, and less infection risk from repeated insertions.
Bedside line organization helps cut down entanglement, contamination, and falls. When IV lines, oxygen tubing, and feeding lines are loose across a bed or trailing on the floor, they become trip hazards. They’re also harder to trace during emergencies or handoffs, which is the last time anyone wants confusion. Structured line-management programs use physical organizers, standard labels, and line checks during handoff to reduce these problems.
One study of a specific line organizer reported zero line or tubing incidents during the observation period. One example is BeataClasp, a line organizer used in hospitals, ICUs, and home care to keep tubing separated, off the floor, and easier to trace.
These steps work better when training turns them into daily habits. Facilities that added line-management skills to annual assessments, used visual guides, and built line checks into hourly rounding saw better compliance. Pump data and incident reports also helped show which units needed the most attention, helping improve override rates, incident counts, and unplanned restart rates.
| Intervention Type | Primary Metric | Reported Outcome | Patient-Safety Relevance |
|---|---|---|---|
| Smart pump CQI analytics | Averted programming errors | 1.6 averted errors per 1,000 patient days | Prevents serious and life-threatening IV medication ADEs |
| Catheter stabilization devices | Unplanned IV restarts / dwell time | Fewer restarts, longer dwell time | Fewer needle sticks and less risk from repeated insertions |
| Bedside line organization | Tubing entanglement / floor contact | Zero line or tubing incidents during the observation period | Reduces falls, contamination, and accidental dislodgement |
Which IV Line Safety Metrics Matter Most and How to Use Them
Core Metrics: Complications, Infections, Costs, and Device Events
Once you know what helps, the next step is simple: measure the right things by following a practical path to safer hospital environments.
Data-driven IV safety usually comes down to three metric groups: harm, adherence, and cost.
For clinical harm, the metrics reported most often are CLABSI rates per 1,000 central line-days, peripheral IV complication rates such as phlebitis, infiltration, occlusion, and dislodgement per catheter or per 1,000 catheter-days, and smart pump error metrics. NHSN reports CLABSI per 1,000 central line-days because that adjusts for exposure time. Raw counts don’t do that.
For adherence, checklist and bundle adherence rates are some of the best leading indicators. They tell you whether staff actually used the protocol, not just whether a bad outcome happened later. One pediatric academic medical center tracked all-element bundle adherence and found that it increased from 25% to 44% between September 2018 and December 2019 after a real-time dashboard was put in place. Unit-level accountability increased too.
That tells you whether the process is being followed. Cost metrics show what happens when it isn’t.
For resource use, track incremental hospital days and direct cost per complication. A multi-hospital network study found attributable length of stay differences of about 9.7 days per CLABSI case across 43 hospitals, along with added variable costs of thousands of dollars per case. That adds up fast. Even small drops in complication rates, spread across many devices and admissions, can lead to meaningful cost avoidance.
Conclusion: Data Visibility Supports Safer IV Line Care
Across studies, the pattern is pretty clear: unit-level data plus regular feedback lowers harm. IV line complications bring a measurable clinical and financial burden, and programs that track the right metrics - in a steady way, at the unit level, with regular feedback - reduce that burden. Smart pump logs, infection dashboards, and bedside practice audits help cut harm when teams review them on a routine basis.
The table below links each metric to its main data source and how teams use it.
| Metric | Primary Data Source | Use |
|---|---|---|
| CLABSI rate (per 1,000 central line-days) | Infection-control surveillance (NHSN) | Central line infection burden by unit and catheter type |
| PIV complication rate (per catheter or 1,000 catheter-days) | EHR nursing flowsheets | Phlebitis, infiltration, occlusion, and dislodgement |
| Checklist/bundle adherence (%) | Audit tools, QI forms, observational logs | Whether insertion and maintenance protocols were followed |
| Averted pump errors (per 1,000 patient days) | Smart pump CQI event logs | Intercepted programming errors and override patterns |
| Incremental hospital days and costs | Hospital billing and financial systems | Financial and capacity impact of IV-related complications |
| Line-related incidents (entanglement, falls, contamination) | Incident reports, risk management systems | Physical line safety at the bedside |
FAQs
Which IV safety metrics should hospitals track first?
Start with metrics tied to IV line incidents, including dislodgements, entanglements, contamination, and events that require nursing intervention.
It also helps to track line-awareness protocol compliance. That includes placement documentation, labeling accuracy, and routine site assessments.
Then look at patient and staff results tied to those issues, such as:
- Infiltration
- Infection
- Caregiver satisfaction
- Time spent managing tubing complications
This gives you a clear view of both the day-to-day problems and the patient care impact.
How often should units review IV line data?
Review frequency depends on the patient’s condition and the type of line.
For standard inpatient peripheral IV sites, staff should check the site at least every 4 hours. Pediatric and neonatal patients need hourly monitoring. Critically ill or cognitively impaired patients need checks every 1–2 hours.
Saline locks that aren't in continuous use should be flushed every 8–12 hours.
Facilities should also run regular competency assessments and monitoring rounds to help staff follow these practices consistently.
Why does feedback work better than training alone?
Feedback often works better than training on its own because it gives teams an active, visual, repeatable way to check safety in high-pressure clinical settings. Training builds the base. Feedback loops help that knowledge stick when the pace picks up and mistakes are more likely.
Tools like digital checklists, team communication boards, and visual aids such as the Beata Clasp create immediate checkpoints for line tracing and compliance. In plain terms, they help staff spot problems and fix them before an error reaches the patient.